AI-Demo Architecture
AI & Data Demonstrator - System architecture
Introduction
We built an interactive exhibit for the "Deutsche Hygiene Museum" in Dresden, Germany. The exhibition is about AI, and we bring attention to the role of data in the development and deployment of AI systems. The following series will explain the details abouts its concept and how it was achieved. More details about the motivation of our research institute to address this topic can be found here (German).
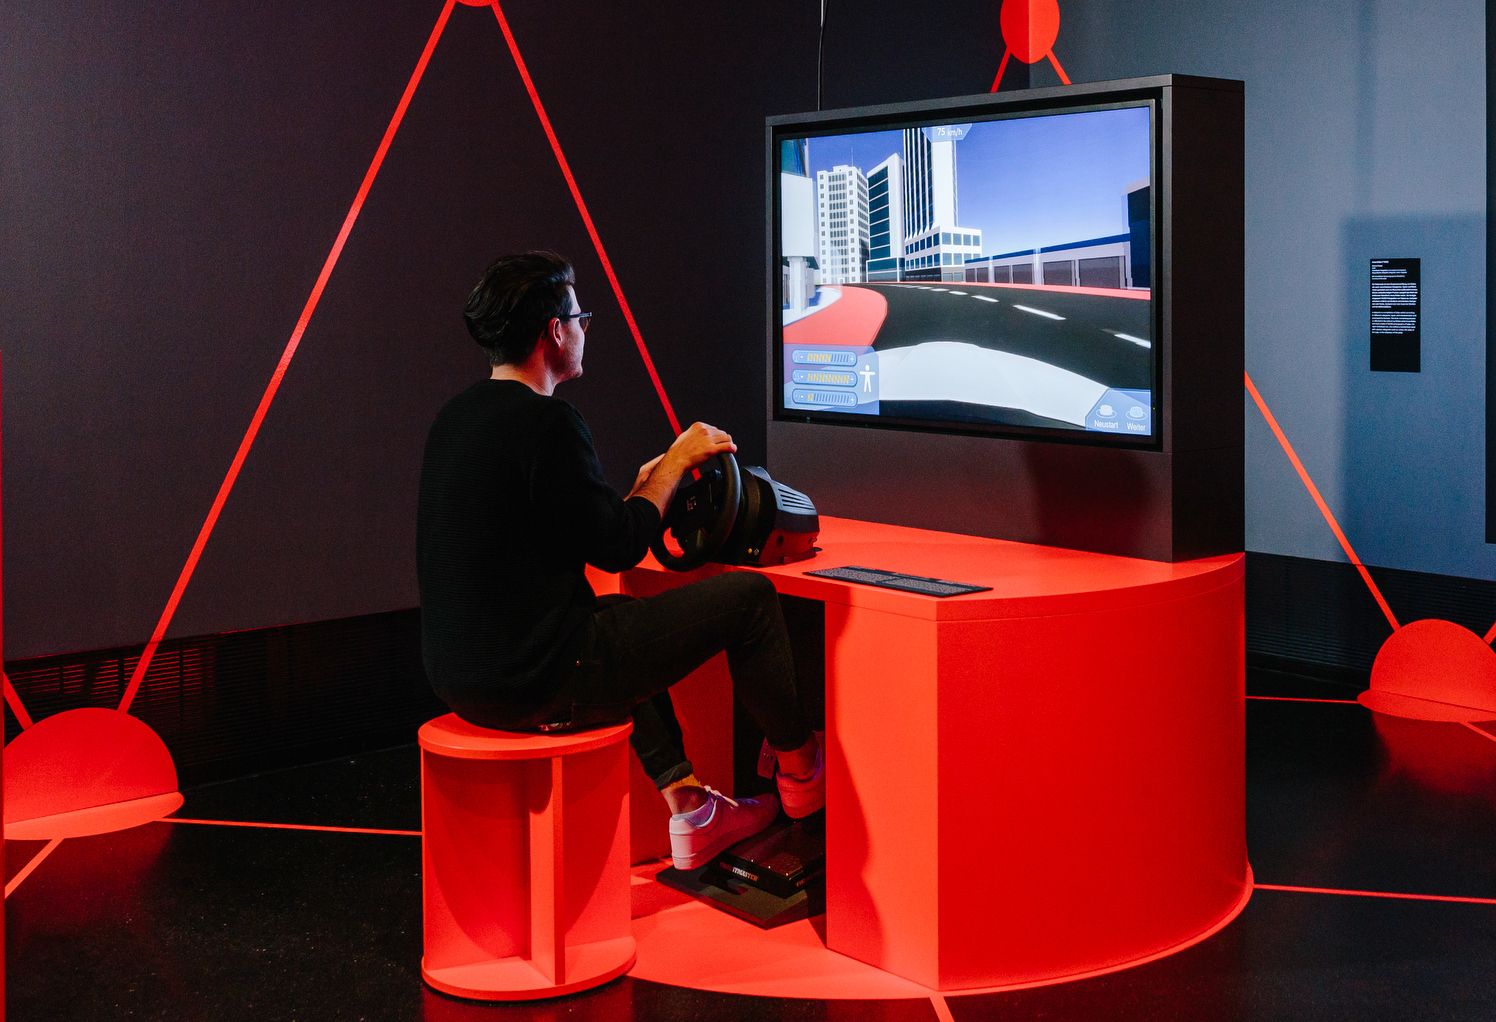 The finished exhibit in the AI exhibition. (c) Oliver Killig
This is a two part series
- Part 1 explains the requirements, user experience and system architecture.
- Part 2 explains details of the AI implementation.
Mission statement
We strived to build an exhibit which successfully delivers the message
AI can only be successfully developed and deployed with enough data of good quality.
Understanding this highlights the value of data.
Requirements
Besides the obvious task of successfully delivering the message, the exhibit had some constraints introduced by our policies or by the exhibition context.
- Interactive design: We believe a physical exhibit or demonstrator should always be interactive to increase the feeling of authenticity and relatedness. Otherwise, a carefully directed and animated video would probably be better suited to deliver the message.
- Standalone operation: The exhibit will be part of a museum exhibition and therefore has to run 7 days a week without supervision. Therefore it has to have an easy/automatic startup and shutdown capability as well as run without robustly without further explanation.
- Minimum development efforts: Since we build unique prototypes rather than products, our main costs are development time. Therefore we strive to reuse as much of our previous work as possible. Further, we are forced to simplify our projects as much as possible. Although this goes against the instinct of the playful engineer it is crucial to be able to finish projects successfully and in time.
- Ease of Use: We expected that visitors only spent 2-5 minutes with the exhibit. Therefore, the user-experience has to be short and intuitive to understand to maximize its effectiveness.
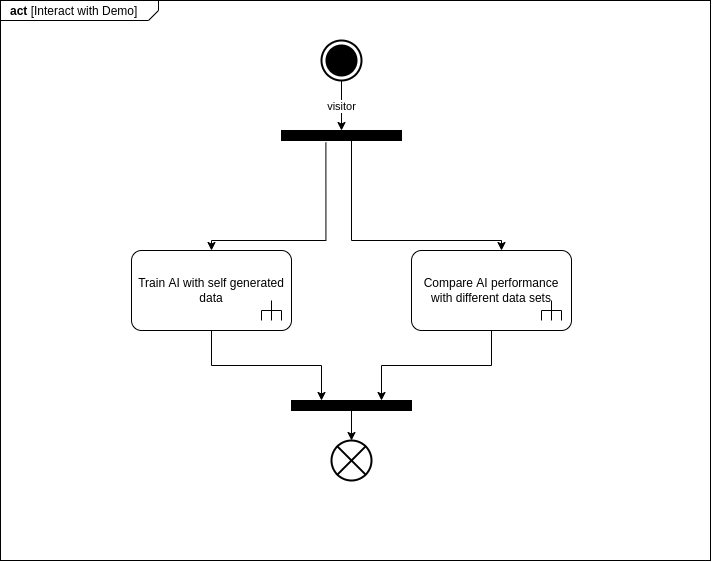
Visitor's Experience
We used a creative process using the online whiteboard tool Miro (which we replaced with collaboard in later projects due to privacy concerns). THe process began by sketching out a visitor experience which would successfully deliver our message. Visitors shall be able to relate to the use-case and be able to connect it to their prior experience. Two concepts were promising, to highlight the importance of data and could be built as exhibits.
Personal Data collection and Analysis
The idea of collecting seemingly harmless data of visitors to surprise them later with revealing insights was intriguing. After all, this highlights the potential and also risks of using AIs with our personal data. However, not only is this kind of exhibit a controversial choice in a museum. It's also very risky, as we didn't know if we could collect enough data to actually predict any interesting or revealing facts.
Autonomous Driving
We devised a very visual and interactive concept, involving teaching an AI to drive a car. This topic is highly visible in the society and, therefore, visitors can easily relate. The concept is split in 2 parts.
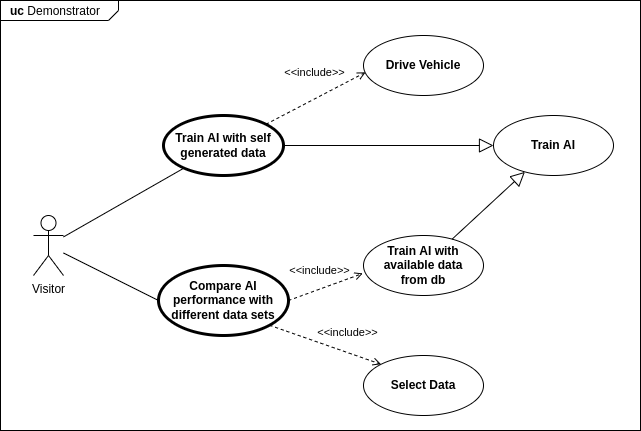
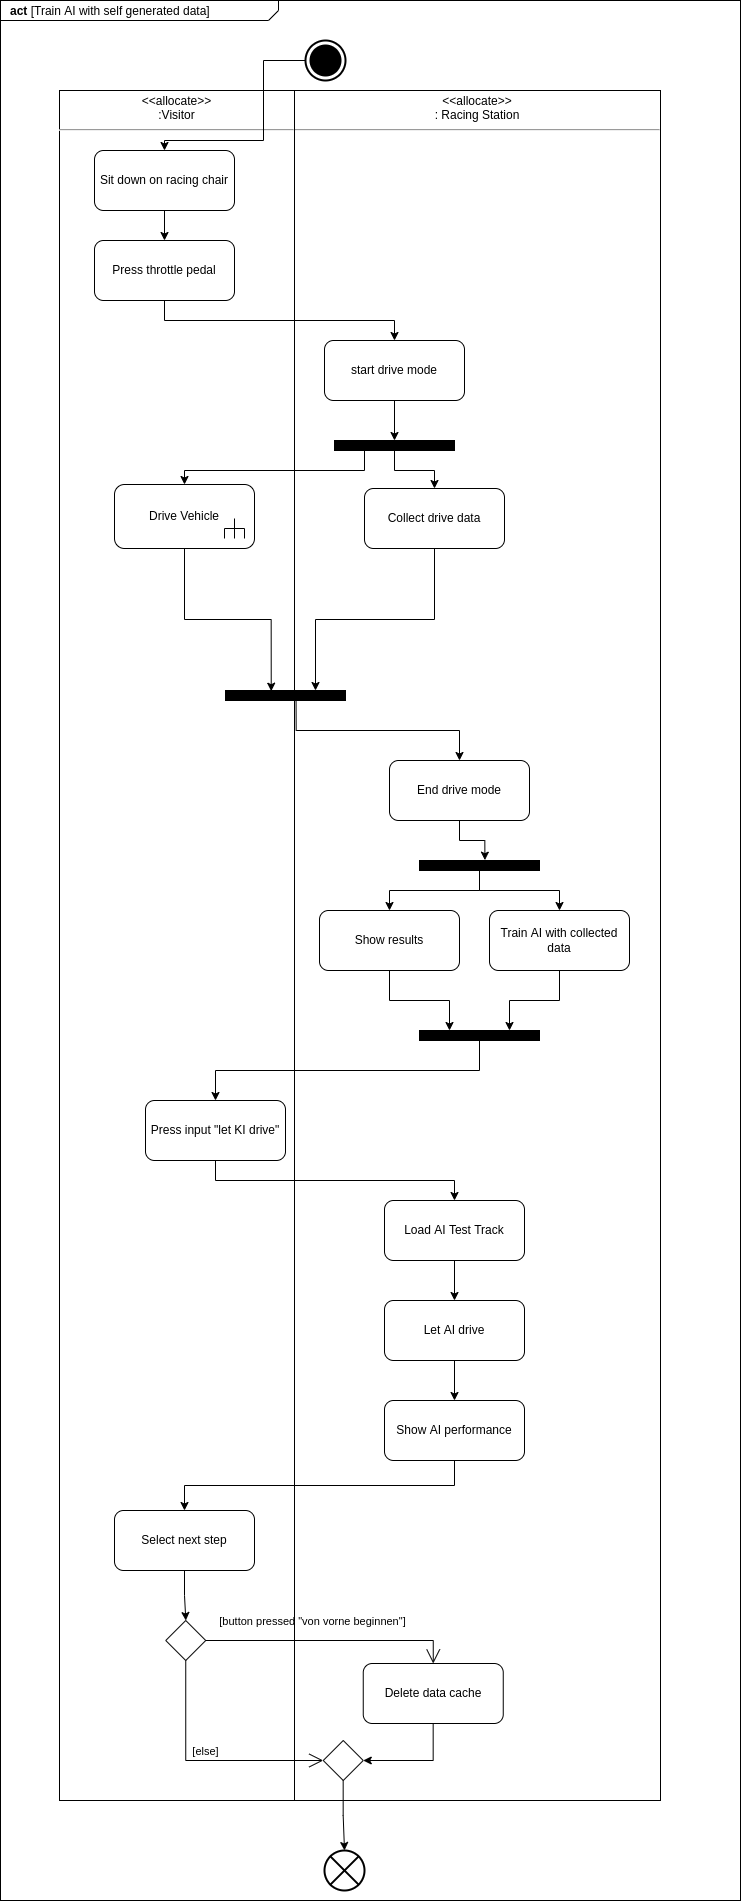
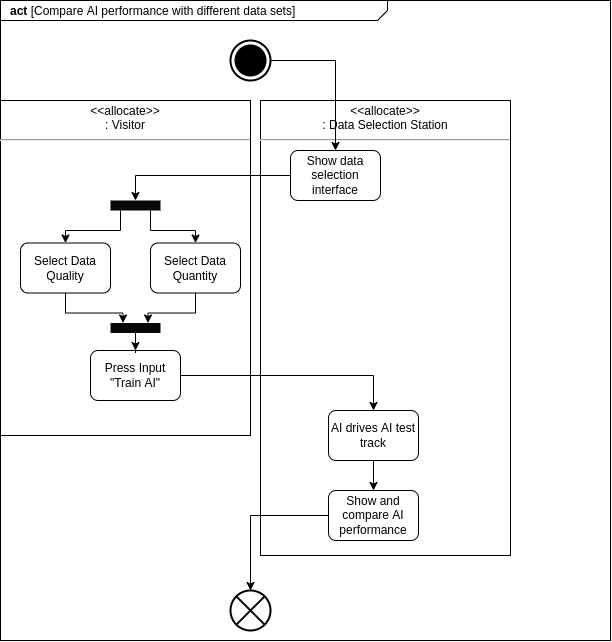
Part 1 - Racing Station
- The visitors sit in a racing chair and drive a car around a training track.
- Their performance is evaluated using simple metrics like average speed and crash rate.
- When time is up or enough data are collected, an AI is trained using the visitors control data (i.e., steering and throttle) as well as vehicle sensor data.
- The AI drives autonomously on an AI test track.
- A comparison between the visitor's and the AI's driving performance reveals the relationship between the training data and AI behavior.
Part 2 - Data Selection Station
In part 2, visitors compare 2 different AIs by
- selecting training data from all the collected visitor data so far.
- repeating this selection process for the second AI.
- Letting the AIs compete on the same track and compare their performance.
An important reason, why we selected this concept, was our know-how and toolchains we already acquired when building the [connected cars demonstrator](). The following section will explain this in detail.
System Architecture
The implementation of the Autonomous Driving concept targeted heavy use of already existing components in our portfolio. Specifically our autonomous driving stack of our connected cars demonstrator using ROS 2 and the simulator LGSVL, where we implemented a digital twin for development and testing. LGSVL is based on Unity3D and is Open Source. Additionally, both "stations" use the same software with different configurations.
Racing Station
Starting with the Racing station, we used off-the-shelf gaming equipment used for racing games for the car control. Not shown in the diagram is the extra Windows PC we had to use due to missing drivers for GNU/Linux, which is the OS of the workstation everything else is running on.
It was important to us to reuse our existing know-how and toolchain to cut development time. Further, our team had little knowledge about C# and Unity3D development. Proper integration and testing together with the LGSVL source code would've also been risky.
That's why any inputs and outputs where routed through the ROS 2 bus and processed by custom nodes, rather than implementing everything inside Unity3D. The internal block diagram shows that the 2 major sub systems here are the Vehicle Control System R and the 3D Drive App. The following section will discuss both.
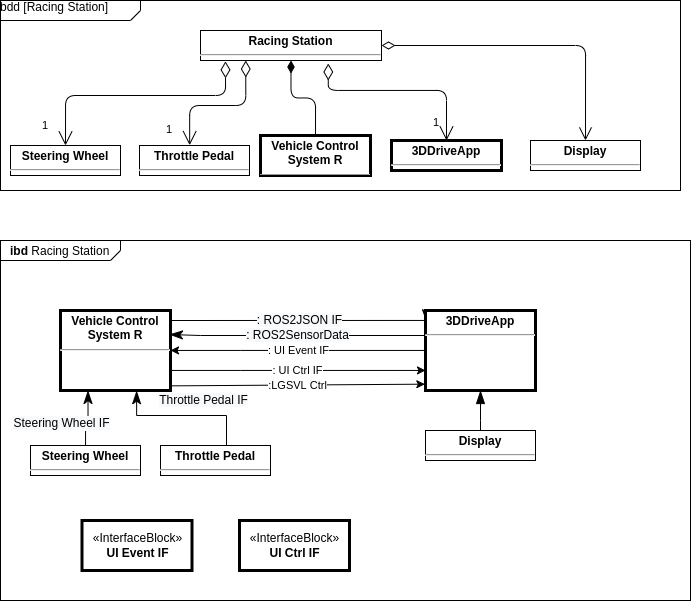
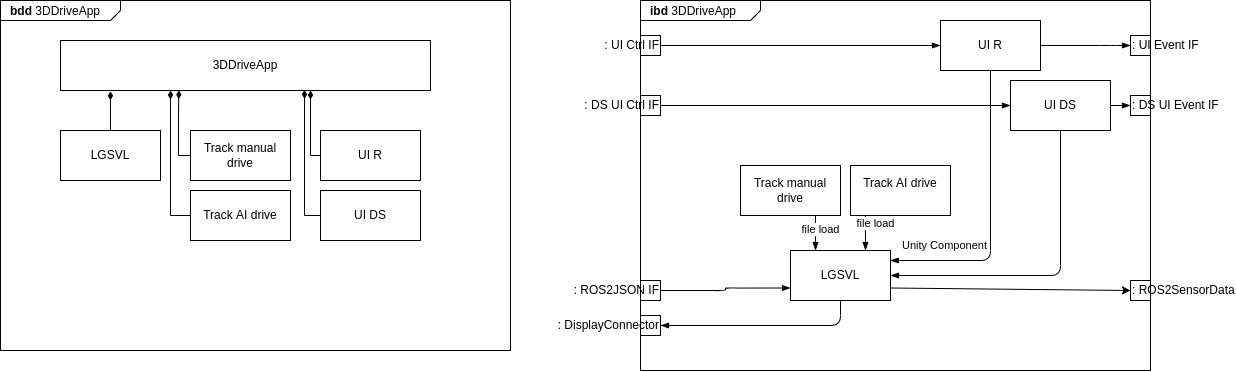
The 3D Drive App is simply the LGSVL simulator with a custom UI component on top, to guide the user through the experience. To minimize complexity and error sources this component was designed stateless. Incoming ROS 2 messages are used to directly control the vehicle. Sensor readings for the AI training data set are send out through the same interface.
UI control uses the same REST API webserver already provided by LGSVL for simulation control by implementing new Nancy modules.
Two environments (or racing tracks) have been implemented to highlight, that the AI can generalize to another layout, rather than just exactly copying user inputs. Track manual drive is used to collect training data, Track AI drive is used to test the AI.
The UI components are always loaded and act like an overlay. They activate and react to commands from the REST API.
The REST APIs UI Event IF (signal user inputs like button presses to the backend) and UI Ctrl IF (change UI commands) have been designed and documented using OpenAPI (formerly known as "Swagger").
Although we intended to reuse as much as possible from prior work, the Vehicle Control System only made use of the simulation control library and rosbridge. Data collection, AI training, AI, the exhibits state machine, performance monitor and manual driving via steering wheel where completely new ROS 2 components.
The advantage remained that we already had prior knowledge about the ROS 2 development toolchain and could distribute the development work in the team, due to ROS 2's decentralized, modular nature.
Details about the AI will be explained in a follow-up article.
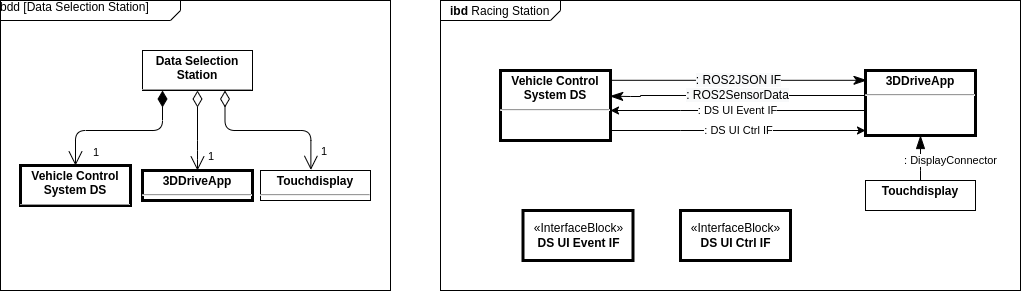
Data Selection Station
The second part of the exhibit uses the exact same architecture, but in different configurations. After some iterations it turned out to be unfeasible to remain consistent with the decision of a stateless UI and a stateful backend. Direct interaction with the Data Selection Station UI through touch, many UI states and far less backend states made it necessary to reverse this rule. However, we sticked to the decision, only one major component should have a state. Therefore, all the configuration is done via the UI which actively polls the backend for information whenever the user changes the data selection.
The final settings for the training data selected by the user are then pushed to the backend using the DS UI Event Interface.
Physical Design
Besides the technical implementation, the look of the exhibit was mostly determined by the style guide produced by the museum. Our interaction concept was stayed the same except the racing chair, which was replaced by themed furniture.
Conclusion
The design process for an interactive, unsupervised museum piece exhibit includes a lot of engineering. As a research institute we tried to link a fun and playful interactive experience to our main research focus. The presented design tries to achieve this by training an actual AI while reducing development effort by using software components we already developed. We hope our modular development style will enable us to build engaging, interactive experiences even faster in the future. This approach also eases distribution of work among the team. The described highlights, that the design phase includes a lot of iterative steps, which require to re-evaluate, discuss and adapt our ideas.